
NPS Response Rate: How to Measure and Improve It
NPS response rate shows how many invited people completed the recommendation question. Calculate it before interpreting a score, compare the same channel and audience, and avoid treating one percentage as universal.
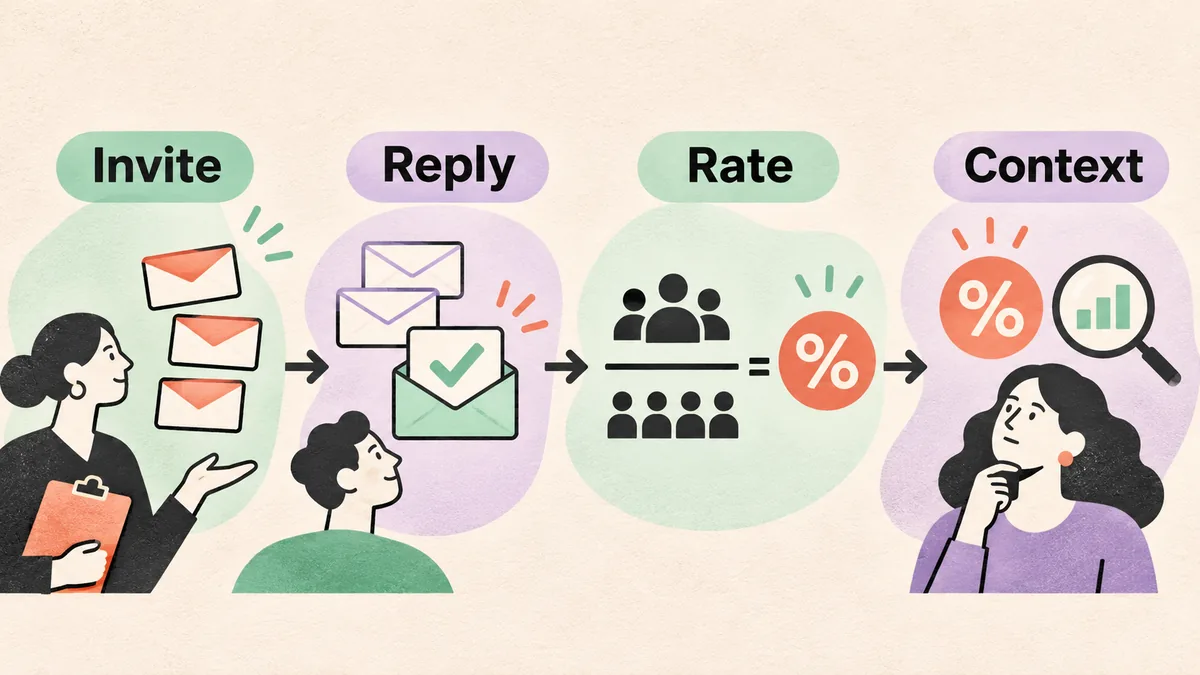
What does NPS response rate mean?
NPS response rate is the percentage of invited or reached people who complete an NPS question. It differs from the NPS score: the score describes the balance between promoters and detractors, while the rate shows how much of the audience you heard from.
A small or selective group can still produce a confident-looking score. If mostly enthusiastic customers answer, the result may overstate the wider experience; if recent detractors dominate, it may understate it. A response rate does not prove representativeness, but it signals when to inspect the sample.
Define the denominator before reporting. Delivered emails, eligible accounts, and people who saw an in-app prompt are different populations. Record invitation rules, delivery failures, duplicates, and exclusions so another person can reproduce the rate.
| Field | What to record | Why it matters |
|---|---|---|
| Invited or reached | The exact eligible audience and channel | Defines the denominator |
| Completed replies | Usable 0-to-10 ratings received | Defines the numerator |
| Field dates | Invitation and closing dates with time zone | Shows the period being compared |
| Audience rule | Customer, account, user, or transaction criteria | Prevents mixed populations |
| Survey design | Question, follow-up, length, and reminders | Explains changes in participation |
How to calculate the NPS response rate
Divide completed NPS responses by eligible invitations or reached people, then multiply by 100. If 84 of 600 eligible customers submit a rating, the response rate is 84 ÷ 600 × 100 = 14%. State whether the denominator is sent, delivered, displayed, or otherwise eligible.
Count each person once. A survey view without a submitted 0-to-10 rating is an exposure, not a completed response. Track bounced invitations, opt-outs, duplicates, and suppressed contacts separately instead of silently changing the denominator.
The rate is not a quality score. Pair it with response count, audience, channel, and NPS. A 20% post-support rate is not directly comparable with 20% from a broad relationship email.
- Set the eligible audienceWrite the inclusion, exclusion, and duplicate rules before the survey opens.
- Count usable ratingsUse completed 0-to-10 recommendation answers as the numerator and keep partial views separate.
- Apply the formulaDivide completed responses by the stated denominator and multiply by 100.
- Save the contextStore channel, dates, audience, reminders, response count, and question wording with the rate.
NPS response rate benchmarks depend on channel
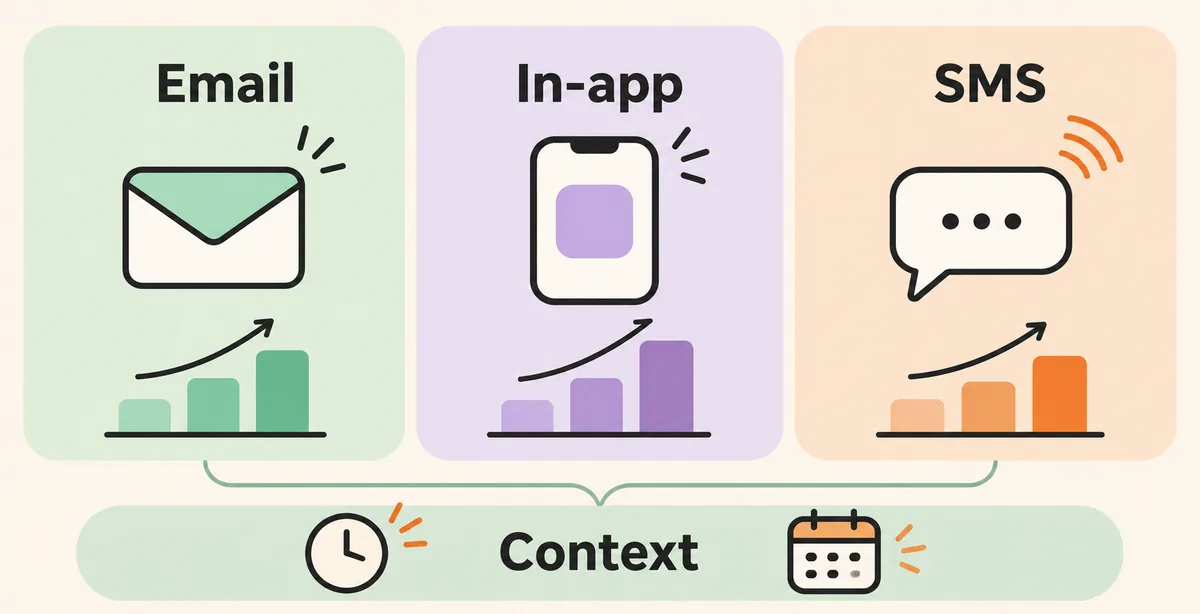
There is no universal good NPS response rate. Email, in-app, SMS, post-purchase, and relationship surveys reach people at different moments. Published vendor ranges can suggest questions, but they are not neutral industry standards; build a baseline from your audience and delivery method.
Keep channel and trigger visible. An in-app prompt after a successful task may get more replies than an email link sent days later. A short transactional question also differs from a relationship survey. Put the method beside each benchmark instead of reporting a bare percentage.
Use the table as a planning guide, not a pass-or-fail scale. Participation depends on audience, trust, timing, language, reminders, and response effort.
| Channel or moment | Useful comparison question | What can move the rate |
|---|---|---|
| Email with an embedded rating | Are customers already familiar with the sender? | Deliverability, sender trust, and one-click access |
| Email with an external link | How many extra steps are required? | Link friction, page speed, and mobile layout |
| In-app prompt | Did the prompt follow a meaningful task? | Trigger timing, user activity, and frequency caps |
| SMS | Is the recipient expecting a short message? | Consent, message length, and the reply path |
| Post-purchase or post-support | Can the person fairly judge the moment yet? | Delay, resolution quality, and question scope |
Read response rate together with NPS
Response rate is a sampling signal, not a correction factor. Do not add it to the NPS score or apply a universal adjustment. Ask who answered, who did not, and whether the response mix changed.
Report NPS, completed responses, eligible invitations, response rate, audience, channel, and field dates together. Where privacy and sample size allow, review segments and comments alongside operational context such as support wait time or activation.
A falling rate with a rising score may mean a smaller group answered; a rising rate with a falling score may mean the sample broadened. Neither pattern explains itself, so record what changed.
- Report the response count and rate next to the NPS score, never in a separate hidden appendix.
- Compare the same audience rule and channel before comparing score movement.
- Review non-response patterns where you can do so without exposing individual identities.
- Avoid claiming that a rate alone proves loyalty, satisfaction, retention, or future growth.
- Mark any change in wording, reminder cadence, eligibility, or delivery platform.
Ways to improve an NPS response rate
Participation depends on design and trust, not just reminder volume. Ask when the customer can judge the named experience, explain the effort, and make the rating easy on a phone. A respectful short request is easier to interpret than a long incentivized form.
Measure one change at a time. Keep the invitation copy, trigger, channel, and reminder rule with each survey wave so you can see what affected participation.
- Name the experienceSay whether the question is about the company relationship, a product, a purchase, or a recent support interaction.
- Reduce the first stepShow the complete 0-to-10 scale with clear endpoint labels and a tap target that works on mobile.
- Choose a fair triggerWait until the customer can evaluate the moment, then send while the details are still clear.
- Limit fatigueSet a contact cap, suppress recent respondents, and avoid asking during an unresolved failure.
- Invite context after the ratingUse one optional, neutral reason prompt and offer contact permission separately.
- Review deliveryCheck bounces, blocked messages, language, loading time, and whether the link opens on the recipient's device.
Compare NPS response rates over time
Keep a change log for the question, audience, channel, trigger, dates, reminders, and denominator. Note major customer events beside the wave instead of treating them as noise.
Compare matched periods when seasonality is plausible. Show response counts as well as percentages, and avoid ranking segments too small for a stable view. For high-stakes decisions, consider a research review; a calculator cannot judge sampling quality.
Keep the core NPS question consistent. If its wording or scale changes, start a new series or label the break clearly.
| Wave | Eligible | Replies | Rate | NPS | Context note |
|---|---|---|---|---|---|
| April | 600 | 84 | 14% | +22 | Email relationship survey |
| May | 620 | 96 | 15.5% | +18 | Same audience; reminder copy changed |
| June | 700 | 91 | 13% | +27 | New customer segment included |
Limits, privacy, and a response-rate checklist
Response-rate guidance is directional: participation depends on access, consent, relationship, language, device, channel, and timing. Vendor benchmarks may describe one customer base or study design. Check the population and period, and cite the source beside an external range.
Protect comments and segment views. Remove unnecessary personal details, restrict access to identifiable answers, and do not treat a low rating as permission to contact someone. Ask for follow-up consent separately.
Confirm that your rate is reproducible and its limits are visible. Then calculate the promoter/passive/detractor score and use the score-meaning guide to interpret it.
- I can name the denominator and explain exclusions.
- I have the number of completed ratings and the field dates.
- I have recorded channel, trigger, audience, wording, and reminders.
- I am comparing like with like, or I have labeled the design change.
- I am treating benchmarks as directional context rather than a universal target.
- I have separated optional follow-up permission from the rating itself.
NPS response rate FAQ
What is the formula for NPS response rate?
Divide completed NPS ratings by the eligible invitations or reached people, then multiply by 100. State the denominator clearly because delivered, displayed, and eligible populations produce different rates.
What is a good NPS response rate?
There is no universal good rate. Compare with the same channel, audience, trigger, and survey length. Build a baseline from your own program and use published ranges only as directional context.
Is a 20% NPS response rate good?
It may be reasonable for one email audience and weak for another in-app or SMS program. Check the channel, timing, eligibility rule, and response mix before judging 20%.
Does response rate change the NPS score?
It does not change the NPS formula, but it changes how cautiously you should interpret the result. A low or selective rate can leave important customer groups unheard.
How can I increase my NPS survey response rate?
Name one experience, send at a fair trigger, keep the first rating step short, make the mobile path easy, limit contact fatigue, check delivery failures, and invite one optional neutral reason after the rating.
Should partial survey starts count as responses?
Use completed 0-to-10 ratings as the response numerator. Keep views and partial starts as separate exposure metrics so the definition stays consistent across waves.
Can I compare email and in-app NPS response rates?
Only with strong caveats. Channel changes access, timing, effort, and audience exposure. Report the method beside each rate and avoid ranking channels with different populations as if they were identical.
Sources for measurement context
The guidance here separates the arithmetic from sampling and survey-design decisions. Bain discusses how low response rates and inconsistent sampling can make NPS scores volatile; CustomerGauge provides a vendor-specific response-rate discussion with B2B examples. Read the original pages before using any external benchmark in a business report.
A response rate makes the score easier to trust
Calculate the rate from a stated denominator, compare the same kind of survey, and save audience and timing context beside the NPS score. Improve participation by making the question timely, short, accessible, and respectful. A higher percentage is useful only when the people answering and the design behind it remain visible.
Calculate an NPS score